Thermo Fisher EliA™ well precision – how is the CV calculated?
Products are for Professional/Laboratory use only
We would like to share with you an overview from Thermo Fisher on the Coefficient of Variation (CV) in the EliA™ well DFUs.
What is the CV?
The CV is an indicator of precision and measures relative variability to indicate the size of standard deviation in relation to the mean in a data set. For determination of EliA well CV, data is analysed from intra-run and inter-run performance.
Where do you find CV information in the DFU?
CV data is found in the ‘Performance Characteristics’ section of the DFU under the heading ‘Precision’ and provides information on the study design including:
- How many runs were completed.
- Number of samples tested.
- Total replicates across all runs.
- Number of instruments tested.
There are specific guidelines used to assess precision and there are many factors that can contribute to potential differences when assessing CVs in the laboratory.
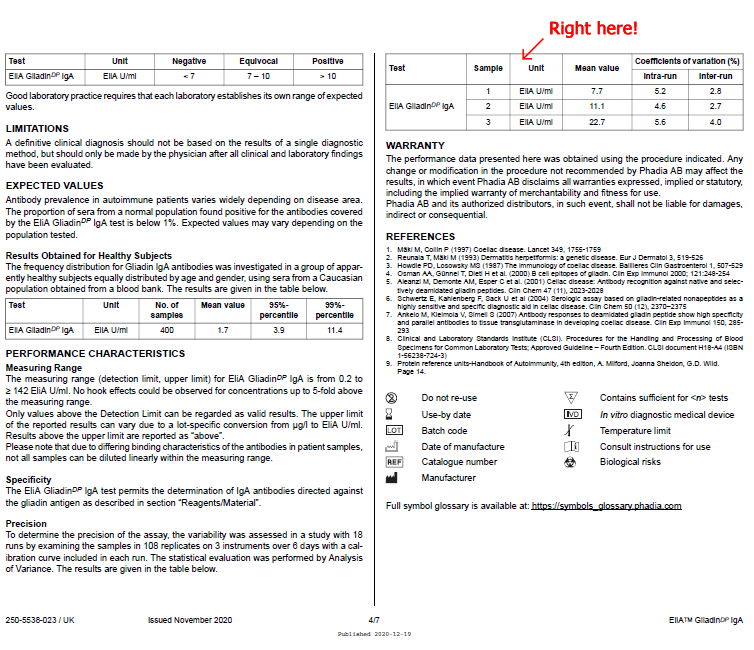
Here is an example: EliA GliadinDP IgA Well DFU for Phadia 250 instrument
|
Precision To determine the precision of the assay, the variability was assessed in a study with 18 runs by examining the samples in 108 replicates on 3 instruments over 6 days with a calibration curve included in each run. The statistical evaluation was performed by Analysis of Variance. The results are given in the table below. |
- 6 replicates per run
- 6 runs on each of the 3 Phadia 250 instruments (in total 18 runs)
- Total replicates: 6 x 6 x 3 = 108
How is it calculated?
- For intra-run CV (or repeatability), a sample is measured in several repeats in one run.
- For inter-run CV (or between-run), a sample is measured in several independent runs.
| Test | Sample | Unit | Mean value | Coefficients of variation (%) | |
| Intra-run | Inter-run | ||||
| EliA GliadinDP IgA | 1 | Elia U/ml | 7.7 | 5.2 | 2.8 |
| 2 | Elia U/ml | 11.1 | 4.6 | 2.7 | |
| 3 | Elia U/ml | 22.7 | 5.6 | 4.0 | |
| Sample | 1 | 2 | 3 | |
| Mean value (Elia U/ml) |
7.7 | 11.1 | 22.7 | |
| Coefficient of variance (CV) | Intra-run | 5.2% | 4.6% | 5.6% |
| Inter-run | 2.8% | 2.7% | 4.0% | |
| Intra-run + Inter-run | 5.9% | 5.3% | 6.9% | |
| Well (lot-to-lot) | 2.0% | 3.1% | 1.2% | |
| Intra-run + Inter-run + Well | 6.2% | 6.1% | 7.0% | |
| Instrument | 2.0% | 2.3% | 2.9% | |
| Intra-run + Inter-run + Well + Instrument | 6.5% | 6.5% | 7.6% |
References
1. Clinical and Laboratory Standards Institute (CLSI). Evaluation of Precision of Quantitative Measurement Procedures; Approved Guideline – Third Edition. CLSI document EP05-A3, 2014; 2. Internal document 3. Directions for use EliA GliadinDP IgA 250-5538-023 / UK; 4. Directions for use EliA GliadinDP IgA 250-5538-023 / US 5. Clinical and Laboratory Standards Institute (CLSI). Preliminary Evaluation of Quantitative Clinical Laboratory Measurement Procedures, 3rd edition, EP10-A3AMD, 2014.


